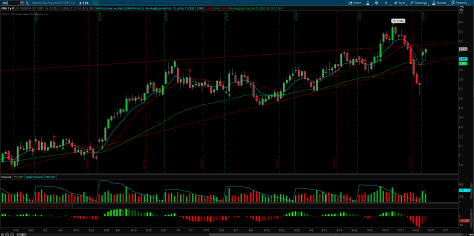
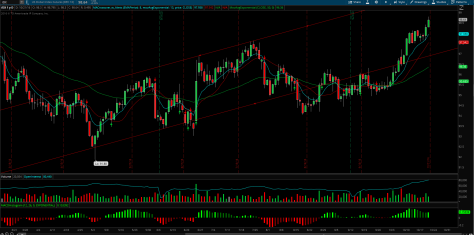
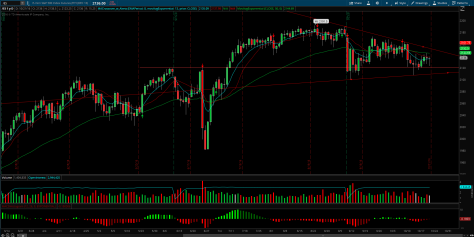
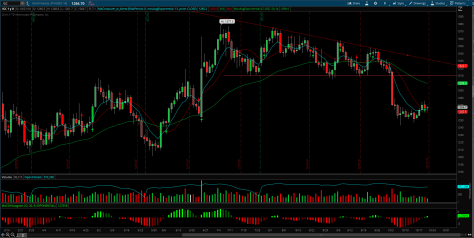
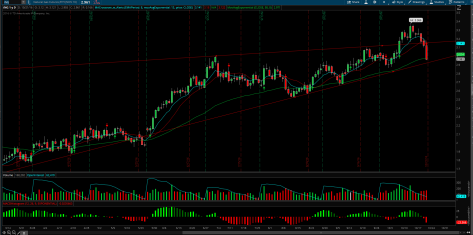
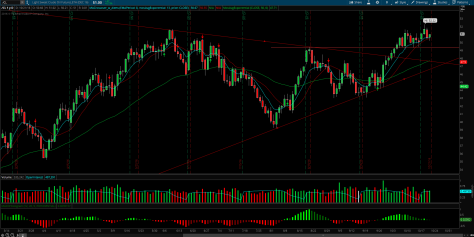
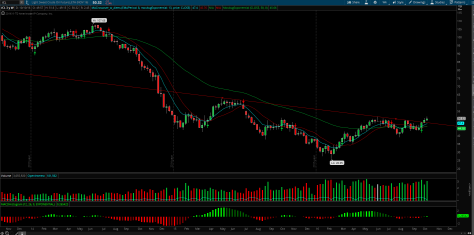
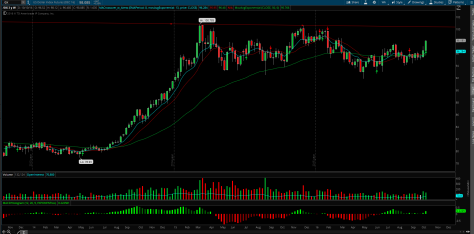
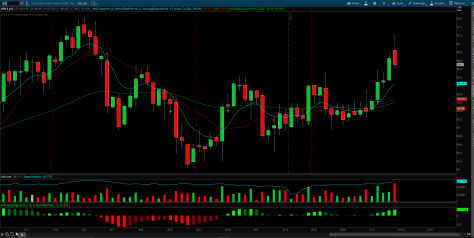
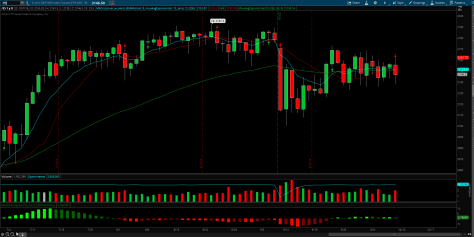
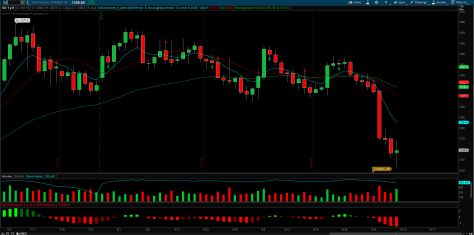
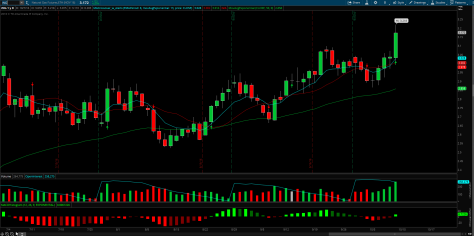
/CL as we mentioned last week, still needs to retest the $48 level here before we make another leg up. Gives the chart a chance to reset the indicators and shake out weak hands. I would be looking for the pullback into the early part of the week and then some grinding for the long CRUDE entry. If the downtrend is retested and the uptrend holds at the same time we should be able to get a nice move off that range./DX bearish engulfing on the daily with indicators all too extended to the upside. I expect to see some downside on here this week. I would like to see the $96.80 retest and some support for another leg up./ES increased sellers here where there should be buyers at the bottom of the pennant. I would be looking for any break on this pennant to be short into a nice pull. Chart keeps making lower highs as the sellers push it downwards. I think we can see the $2100 break this week./GC as the dollar tops off I would be looking to long some $GLD into it’s weakness. I think we should be able to see /GC reclaim the $1300’s this week and possibly test the pennant breakout. At the same time I don’t expect it to break the pennant./NG Chart have reclaimed the uptrend. As it sits here I have doubts as to it’s direction for now with those topping candles printed in the last 2 sessions. I would like to wait for a confirmation of the pennant breakout or breakdown for $UGAZ $DGAZ trades.
/DX Chart held it’s breakout from the $97.60’s. Now that another base is in place should continue to head higher here and the $100 test. At which point I would need to see some consolidation as the indicators are getting extended here./ES chart continues to grind in this range. Continued lower highs but also being supported by a nice trend line. We should be able to test for a breakout in the $2150’s this week. I would wait for breakout confirmation if we get to that range. From the vol bars that have been coming into the support range I think that the breakout fails and the chart retests it’s bottom range again at $2120’s./GC Dark cloud cover on the last trading session suggests to me that this chart fails to get buyers here as it tried to regain some strength. I would be looking for further down side on GOLD here coming into the week. I remain bearish here./NG nice move through the trend breakout. Chart failed to hold the retest but still remains intact as it’s in the support zone. Swift selloff leads me to a initial upside move here into the early part of the week then the real test for this support comes in later on during the week. We should at least test $3.15 again before we choose a direction./CL remains bullish here on this breakout to the upside. Chart is holding this $50 range with conviction that we want higher into the $55’s this week. I will remain bullish here until the chart tells me otherwise.
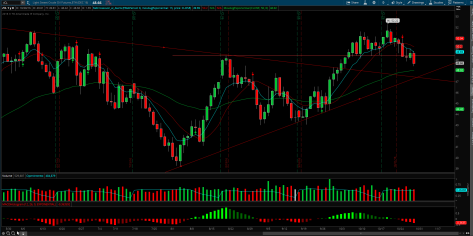
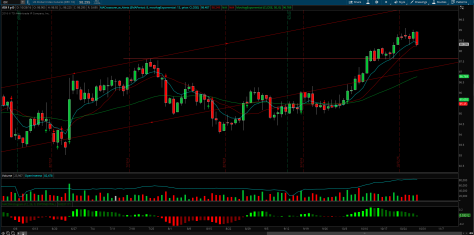
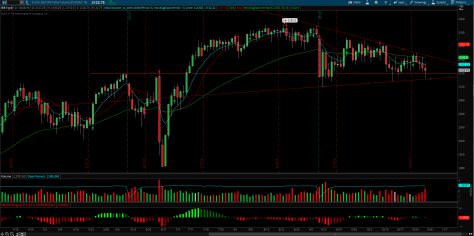
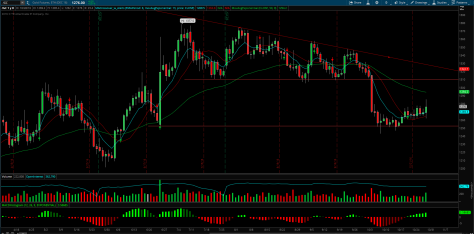
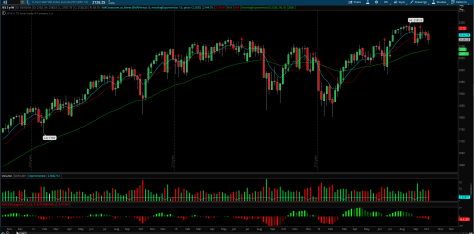
/CL. Broke over it’s downtrend. I would like to see the chart retest the $48 range before a bigger move to the upside. After the chart is reset I think we can see $60’s here again./DX strong dollar here and it still wants more. I would be looking for a small pullback on the chart before it gets ready to test that main downtrend. We can look for some volatility in /GC as it consolidates here in this range. A healthy pullback into the $97 range then move to $100 is what I’m seeing here./ES chart fails to push through and continues to make lower highs here. I remain mostly bearish on the chart and would expect the $2100’s to be broken this week . Ultimately the $2080’s have to hold some support here as that would be the uptrend range and the 50EMA on the weekly chart. /GC closed here under it’s 50EMA on the weekly chart. Will try to recover some here off this range before it heads lower coming into the later part of the year. I would be looking for a hold in this $1250 range for now, I remain short term bullish here as the chart will need to retrace some here and reset it’s indicators for the big pull./NG weekly chart remains bullish as it closed over a breakout area. Buying pressure remains strong into the breakout signals higher move here after it consolidates a bit. I think we can see a retest of the $3 range here in preparation for the move higher.
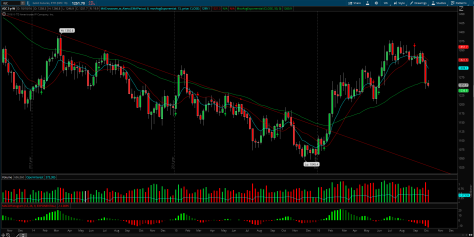
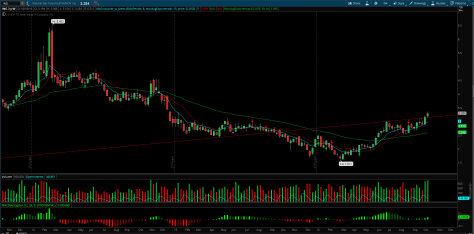
/CL Bearish engulfing at a H&S on the daily chart. I will be looking for continued downside here to the $47.50 level. If that area holds for support it should be a great spot for a long entry towards $55+. Short term indicators needs to be reset so this pullback should prove to be healthy./DX coming into some resistance here on the daily chart. Sellers are here and will continue to remain here until this range is broken out. I’m looking for a short term pullback here to the $96.05 level for support. If that range is met with buyers will be a good bounce area for a move over $98 and towards $100 again./ES continued rejection at the trend breakout range. Also continued support at the pennant break down range. We continue to grind in this wedge until some kind of strong or weak data takes us out. I’m bearish biased but will not sink chips into the bet until it’s a more suitable trade./GC Pin bar reversal candle at the $1250 range. Looks like a great range for a nice bounce back to $1300 where I expect to see sellers and reversal. I remain short term bullish coming into this week then will reverse idea at the $1300 range if I see sellers.
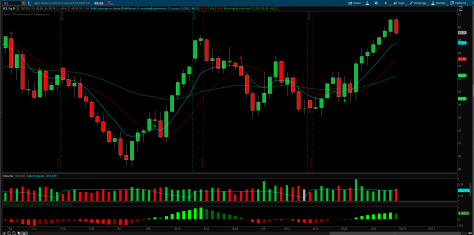
/NG I like the price action here and will be a NatGas buyer here on the dips. Been personally playing $UGAZ on the long side and will continue to do so as long as this trend remains intact. If we maintain this range we can see $3.50+ on this chart in the coming days.